Kafaru SimiTexter: Introducing a new text analysis library in RYou’ve never seen text analysis this easyOct 4, 2021Oct 4, 2021
InTDS ArchivebyAlan Jonesggplot: Grammar of Graphics in Python with PlotnineA powerful graphics library for great visualizationsAug 2, 20202Aug 2, 20202
InTDS ArchivebyAudhi AprilliantThe k-prototype as Clustering Algorithm for Mixed Data Type (Categorical and Numerical)The explanation of the theory and its application in real problemsJan 17, 20215Jan 17, 20215
Inbitgrit Data Science PublicationbyAsel MendisPlotnine: ggplot2 in PythonPlotnine is Python’s answer to ggplot2 in R. R users will feel right at home with this data visualization package with a highly similar…Jul 16, 2019Jul 16, 2019
InPython in Plain EnglishbyJunaid Qazi, PhDA17: Seaborn (Part-2): Statistical Data Visualization (Categorical Plots)This article is a part of “Data Science from Scratch — Can I to I Can”, A Lecture Notes Book Series. (click here to buy your copy today!)Dec 9, 20212Dec 9, 20212
InAnalytics VidhyabyHeitor HermansonData Storytelling to help in your analysisIn this article, I want to show how the book Storytelling with Data helped me build charts that translate complex datasets with text…Jan 3, 2022Jan 3, 2022
InTDS ArchivebyChi Nguyen7-day Challenge — Mastering Ggplot2: Day 4 — Stunning Statistical GraphsExamine your data through insightful graphsJan 4, 2022Jan 4, 2022
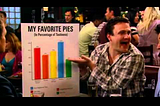
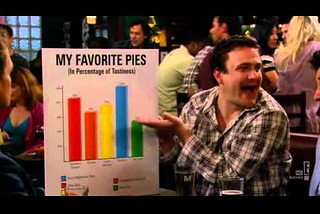
InTDS ArchivebyManasi MahadikExploring Highcharts in RVisualizing trends & patterns in ‘How I met your mother’ using Highcharts in ROct 5, 20193Oct 5, 20193
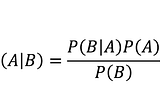
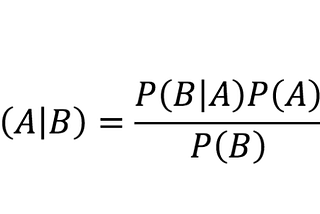
Dr. Marc JacobsStatistical Rethinking — Bayesian Analysis in RIn two previous posts I showed, using Bayes’ theorem, why science is frail and what the impact is on probability estimates if you accept…Dec 6, 2021Dec 6, 2021
InTDS ArchivebyAhmar Shah, PhD (Oxford)R for Beginners: Learn How To Visualize Data Like a ProA case-study-based introduction that will get you started to use the ggplot2 library to create high-quality graphics and learn about the…Jul 13, 20213Jul 13, 20213
InTDS ArchivebyXichu ZhangMake beautiful 3D plots in R — An enhancement on the story-tellingExamples along with data interpretationSep 4, 2021Sep 4, 2021
InTDS ArchivebyMartin Šiklarggplot2 extensions for better plottingExtensions that will help you create better plots more efficientlyAug 12, 2021Aug 12, 2021