Kafaru SimiTexter: Introducing a new text analysis library in RYou’ve never seen text analysis this easyOct 4, 2021Oct 4, 2021
InArtificial Intelligence in Plain EnglishbyAruna SinghExperimentation with Tidyverse in RIn this article, you’ll learn the intertwined processes of data manipulation, extraction and visualization using the tools dplyr and…Jan 21, 2021Jan 21, 2021
InTDS ArchivebyChi NguyenGuide To R MarkdownIf you are looking for a tool to present a neat and effective report, R markdown is an ideal option!Sep 19, 2021Sep 19, 2021
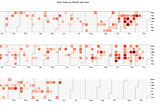
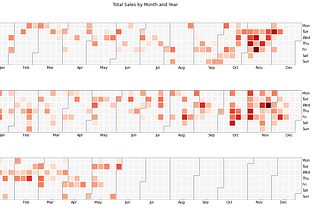
InTDS ArchivebySarang GuptaTime-Series Calendar HeatmapsA new way to visualize Time Series dataDec 26, 2018Dec 26, 2018
InAnalytics VidhyabyHARSHITA GARGCalendar Heatmaps : A perfect way to display your time-series quantitative dataA quick and simple guide to create calendar heatmaps using Python libraries and add interactivity using widgetsNov 20, 20211Nov 20, 20211
InTowards AIbyBenjamin Obi Tayo Ph.D.Tutorial on Barplots using R’s ggplot PackageUsing R’s “ggplot” package for barplots of three different datasetsJul 21, 2019Jul 21, 2019
Inlearn data sciencebyKan NishidaFilter with Date dataWhat if you want to keep the data that is within a certain date and time range. For example, you might want to see your active user data in…Mar 16, 20168Mar 16, 20168
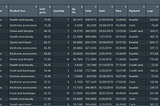
InTDS ArchivebyHamza RafiqBusiness Analysis in RA complete and detailed analysis of a supermarket’s sales and business using Tidyverse and RJun 23, 20191Jun 23, 20191
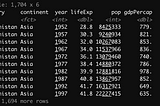
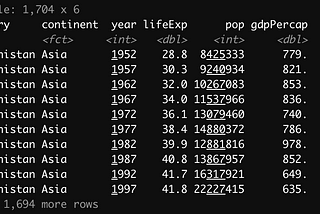
Arimoro OlayinkaTidy Data Case Studies Using RIn the previous article in this tidy data series, I introduced the concept of tidy data and highlighted the principles of tidy data. If you…Oct 8, 20211Oct 8, 20211